Discover how drone inspections with thermography can check PV systems up to 95% more effectively than conventional methods. From flight planning to AI-powered analysis - this is the complete process for maximizing yield and creating DIN-compliant documentation.
Why drone inspections are essential for PV systems
The reality of today's solar market is sobering: according to the U.S. Department of Energy, PV systems on average deliver only 79% of their expected energy output. These performance losses cost operators millions in missed revenue every year and undermine the profitability of their investments.
Traditional inspection methods have clear limitations:
- Visual checks only reveal surface-level damage
- Manual thermography requires dangerous roof access
- Individual faulty modules remain undetected in large arrays
- Documentation is time-consuming and prone to errors
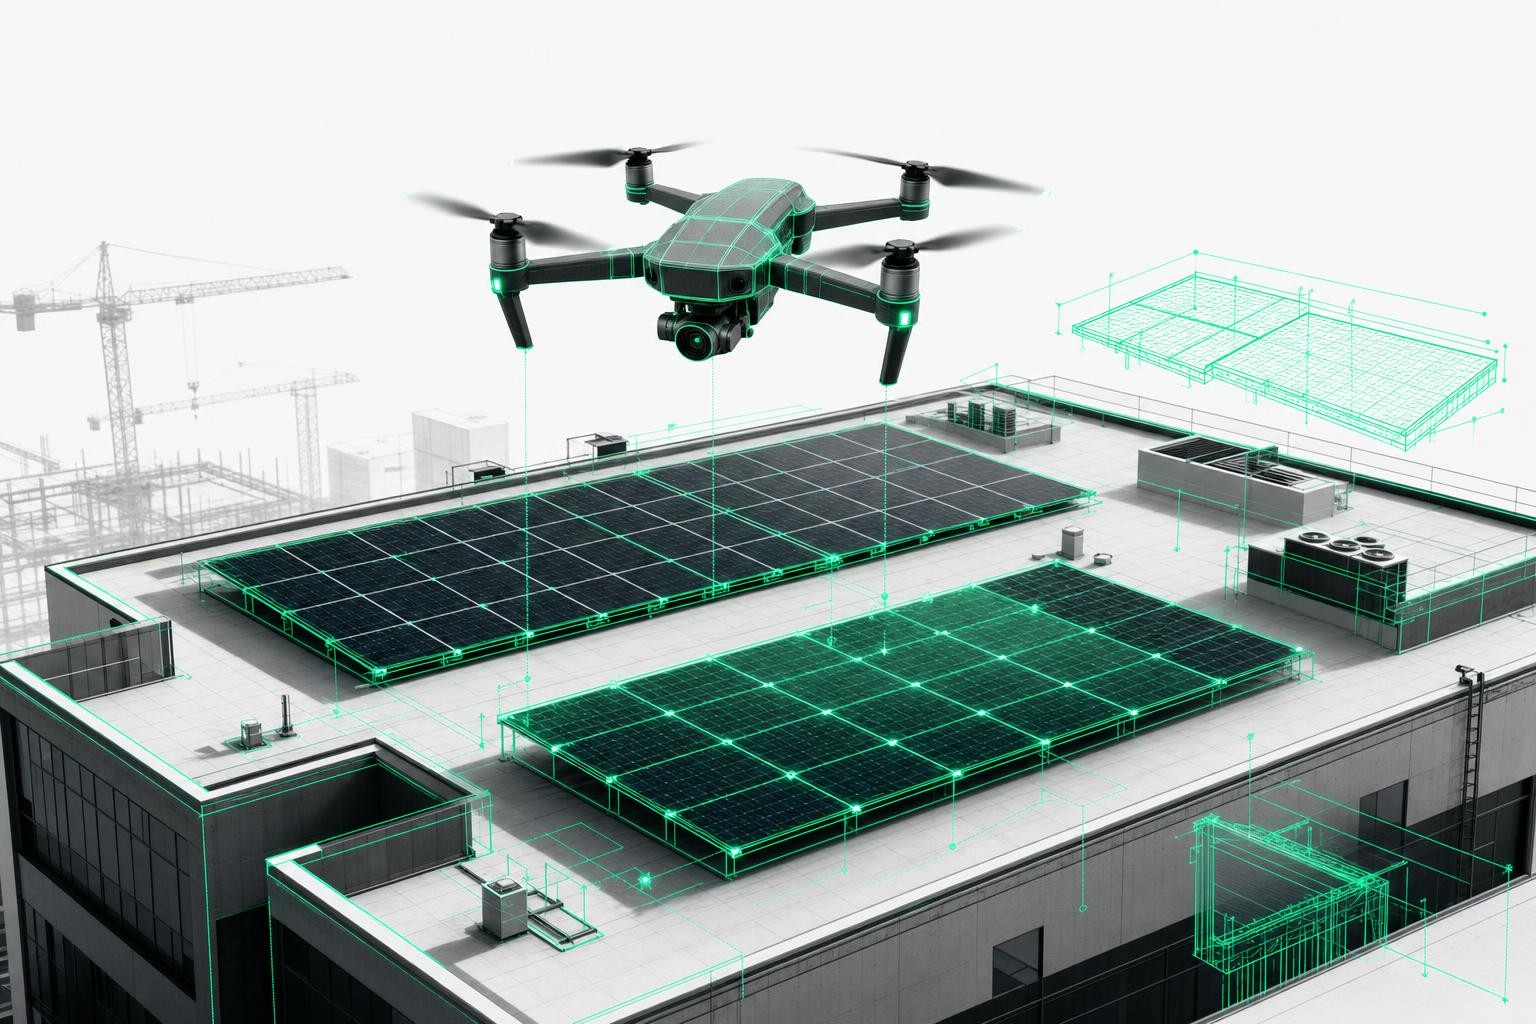
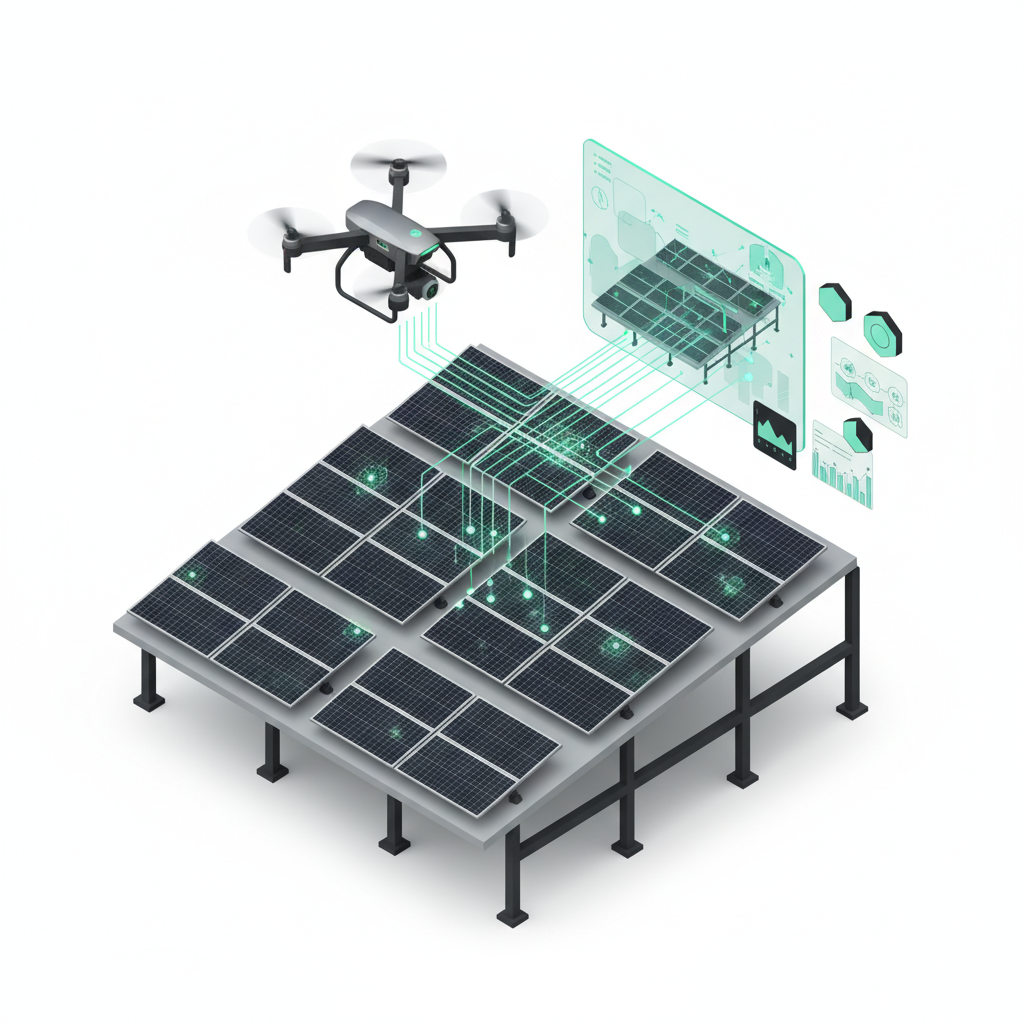
Modern drone technology is transforming this process. Equipped with high-resolution thermal cameras, drones can detect even the smallest temperature differences and achieve defect detection rates of up to 95% - a quantum leap compared to traditional methods.
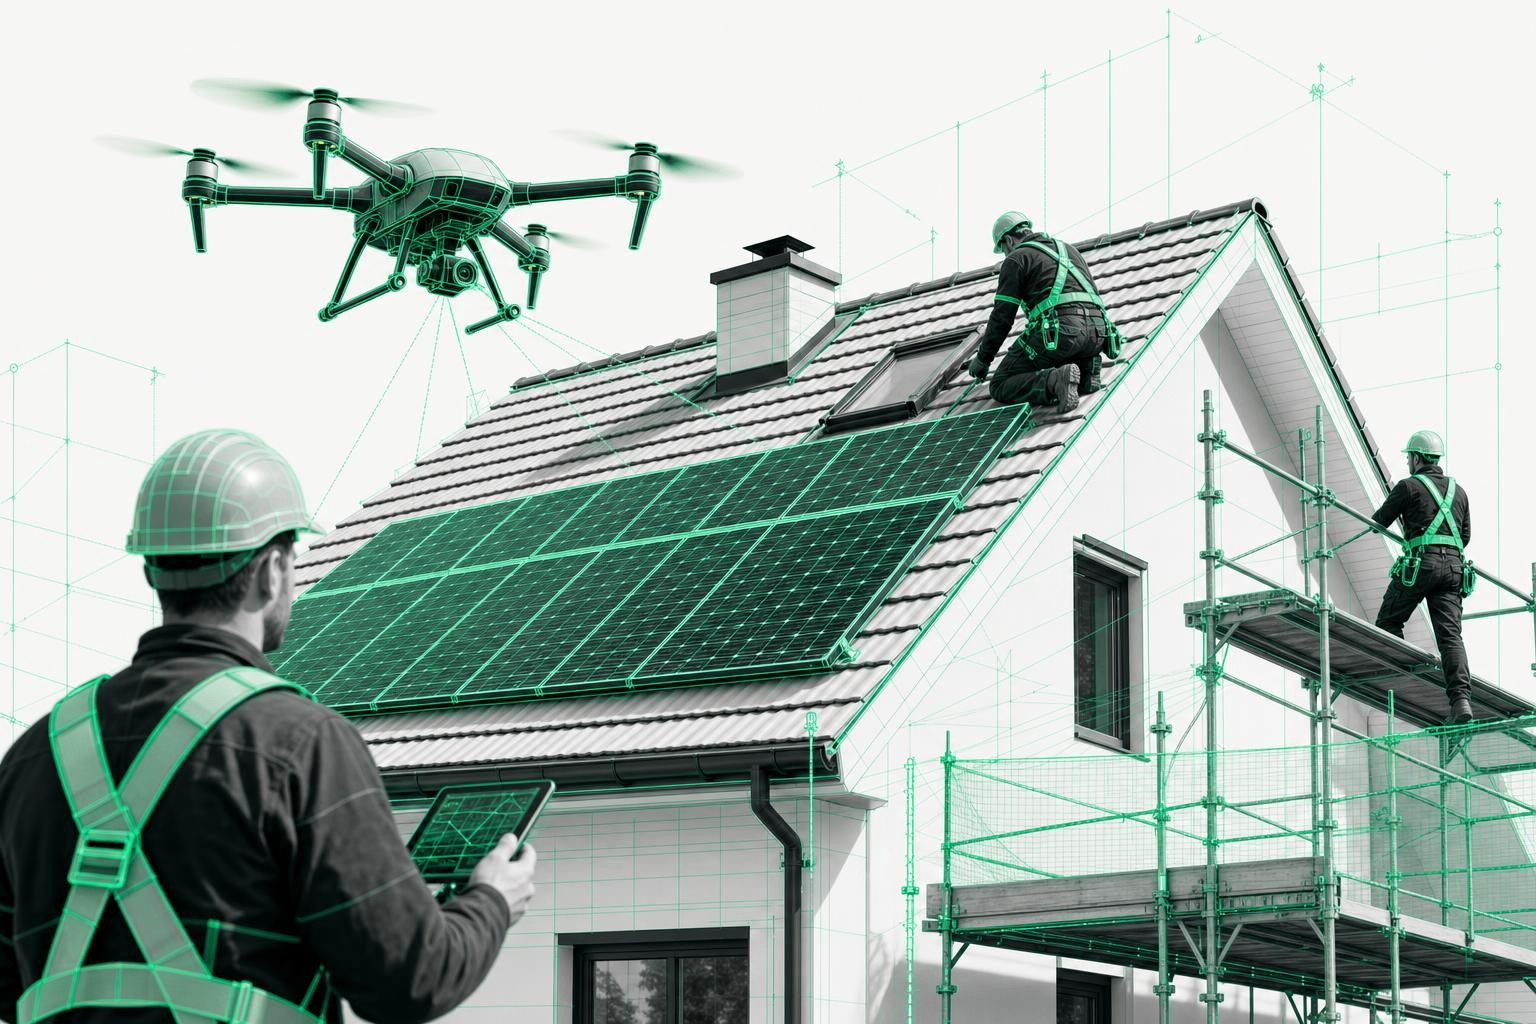
The safety benefits are compelling:
- No more work at height required
- Reduced accident risk for inspection teams
- Unrestricted access even to hard-to-reach systems
- Inspections can be performed during normal operation
The 5-step drone inspection process for PV systems
Step 1 - Pre-planning and permits
A successful drone inspection starts with meticulous planning. Professional providers such as Airteam take care of this complexity end-to-end and ensure smooth operations.
Flight path optimization for maximum efficiency:
- Automatic route calculation based on system size
- Consideration of obstacles and airspace restrictions
- Optimal altitude for centimeter-accurate thermal imaging
- Integration of weather data to secure ideal measurement conditions
Regulatory requirements and permits:
- Airspace clearances for controlled areas
- Proof of insurance and pilot certification
- Coordination with plant operators and grid operators
- Compliance with EU drone regulations and national rules
Identifying optimal weather conditions:
- At least 500 W/m² solar irradiance for meaningful thermal data
- Wind speeds below 10 m/s for stable flight conditions
- Clear skies for uniform module heating
- The system should run under load for at least 1 hour
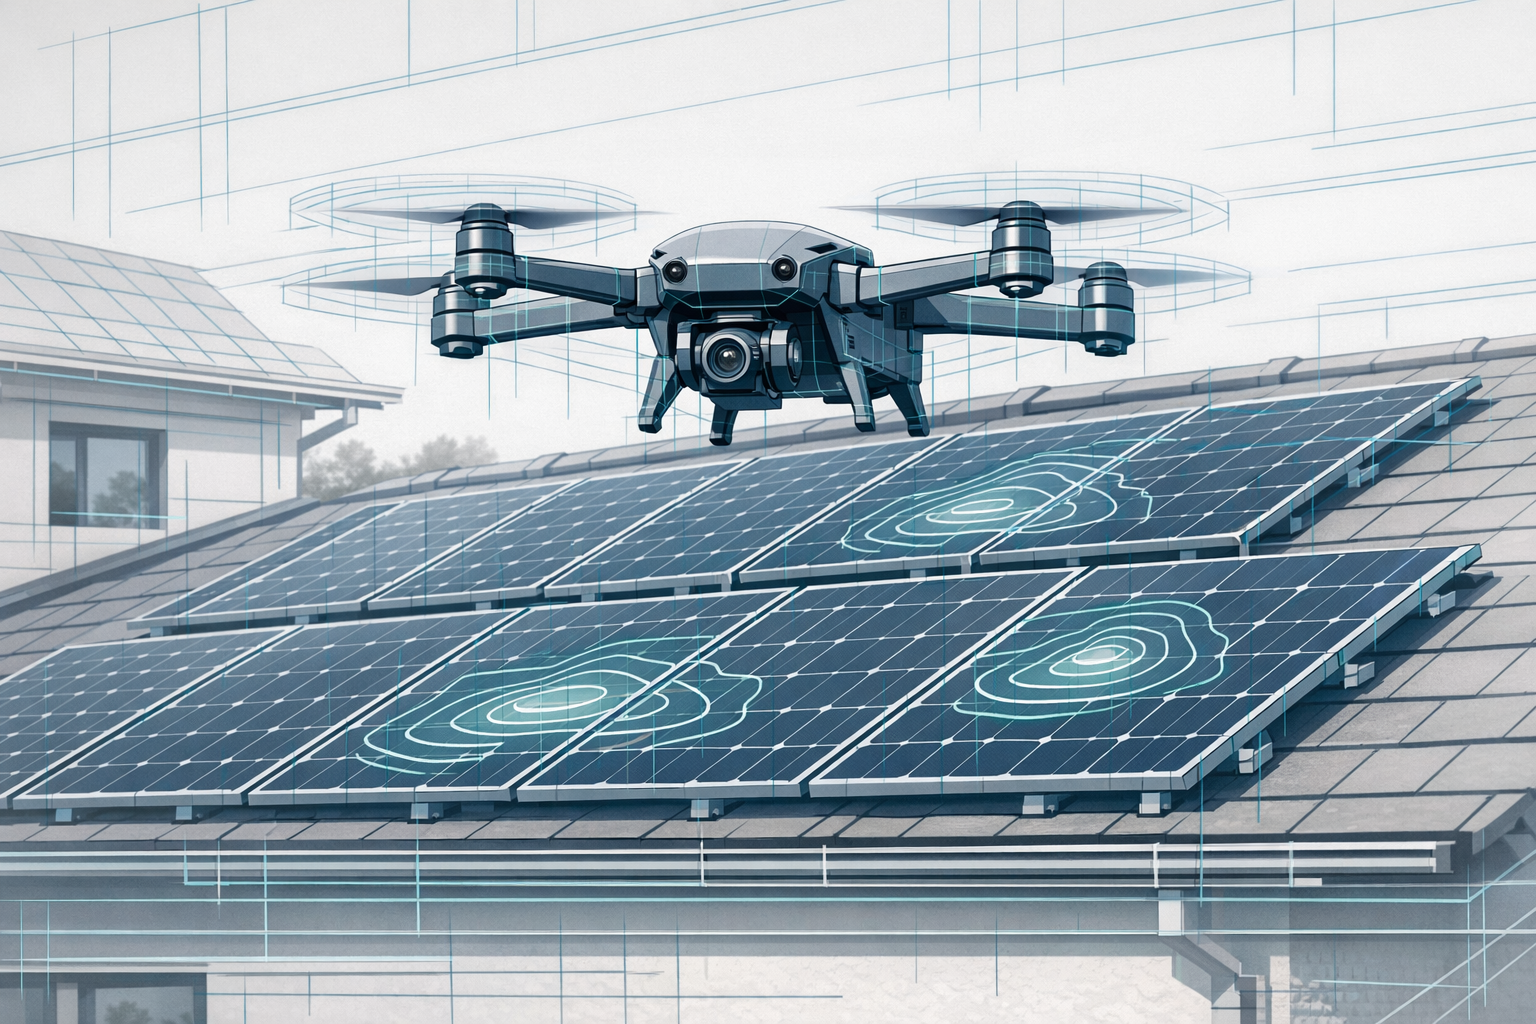
Step 2 - Thermal data acquisition
The core of any drone inspection is precise thermal image capture. Modern professional thermal cameras deliver an accuracy of ±2°C and reliably detect relevant temperature deviations.
Technical specifications of the equipment:
- High-resolution thermal cameras for detailed hotspot detection
- Simultaneous RGB and thermal imaging for easier localization
- GPS coordinates for centimeter-accurate defect mapping
- Solar irradiance measurement for thermography calibration
Flight strategy and data quality:
- 90° nadir shots directly above the modules for optimal thermal quality
- Overlapping flight lines for complete coverage of the system
- Automatic exposure control for consistent image quality
- Real-time quality checks during the flight
Step 3 - Immediate on-site data analysis
One key advantage of professional drone inspections is the live evaluation during the flight itself. Customers can follow the inspection in real time on a monitor and discuss initial findings immediately.
Benefits of live viewing:
- Instant detection of critical hotspots during the flight
- Ability to perform immediate re-flights over suspicious areas
- Transparent inspection process for the client
- Initial assessment of overall system condition on site
Initial hotspot categorization:
- Critical overheating (>15°C temperature difference)
- Suspicious warming requiring detailed analysis
- String failures identified via characteristic temperature patterns
- Shading issues and their impact
Step 4 - AI-powered evaluation and classification
After data capture, specialized AI algorithms perform a detailed analysis. Leading providers like Airteam use deep learning methods to achieve high accuracy in defect detection.
Automated fault classification:
- Hotspots and thermal anomalies with severity rating
- Cell cracks and mechanical damage
- PID effects (potential-induced degradation)
- Soiling and shading problems
- Cabling faults and connection issues
Precise localization and quantification:
- GPS-accurate mapping down to individual modules
- Calculation of temperature deviations in °C
- Estimation of power loss per defective module
- Prioritization based on criticality and repair urgency
Integration into the Airteam Fusion Platform:
- Automatic upload and AI analysis within 24 hours
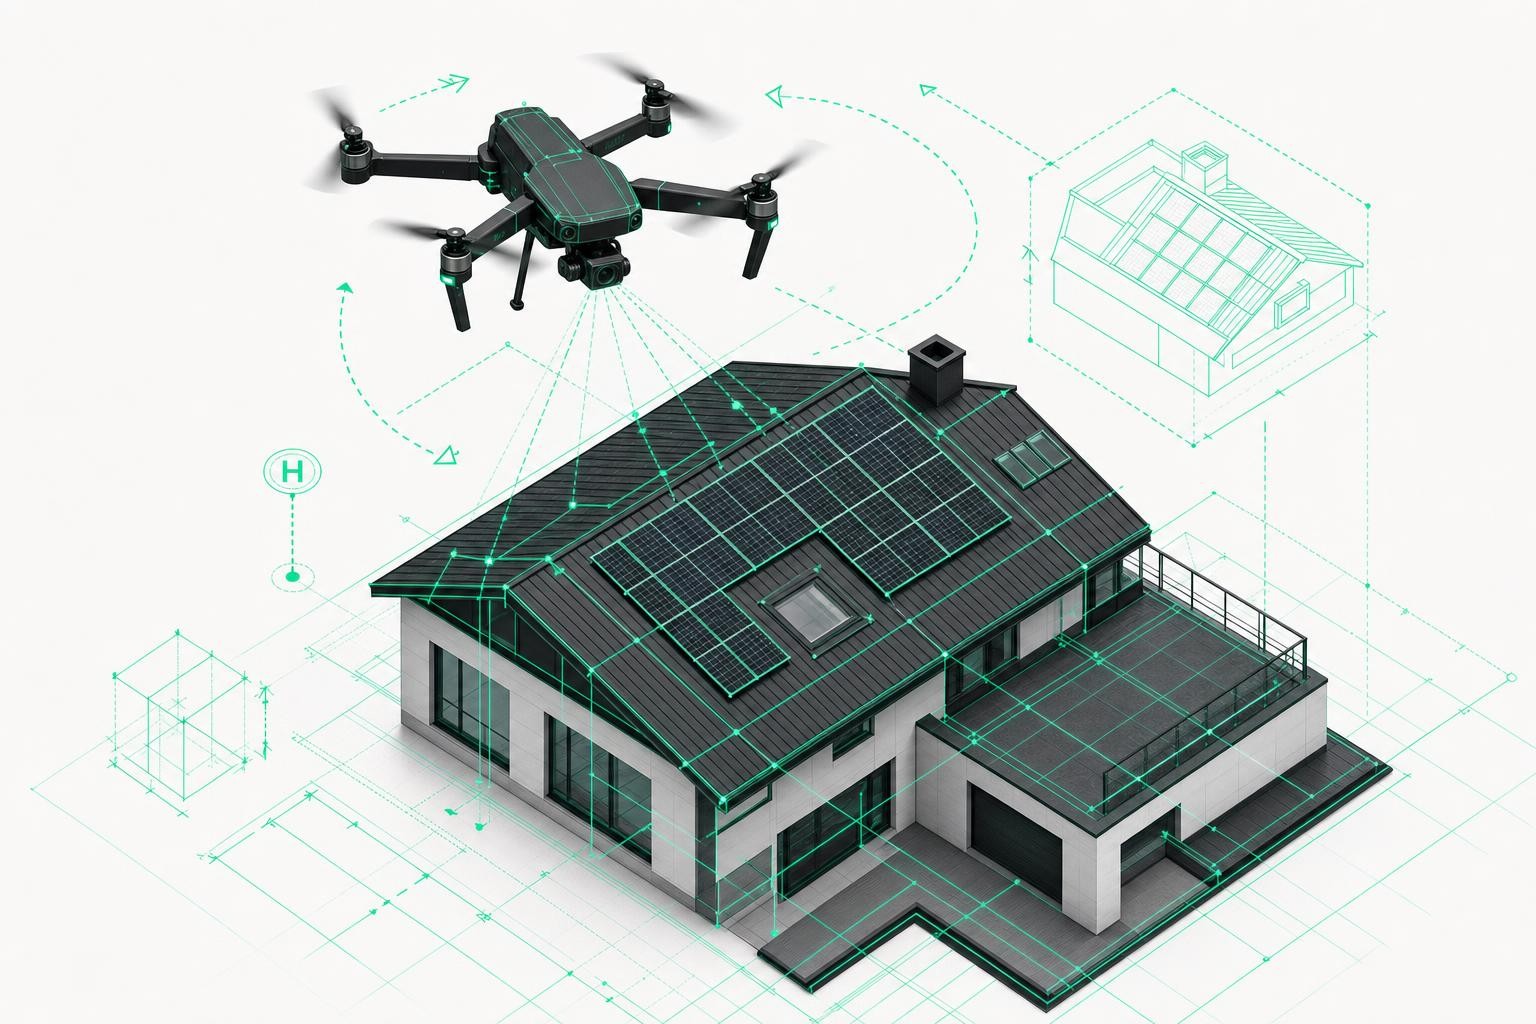
- Seamless linking with 3D models of the PV system
- Export to more than 15 design and maintenance tools
- Centralized management of all inspection data
Step 5 - Reporting and recommended actions
The final inspection result is delivered as a detailed, DIN-compliant report. This is not only used for documentation, but also forms the basis for maintenance planning and warranty claims.
Comprehensive documentation:
- Complete thermal maps of the entire system
- Module-level assessment with GPS coordinates
- Comparison images: thermal and RGB photos
- Historical comparisons for repeated inspections
Financial assessment and action recommendations:
- ROI calculation for recommended repair measures
- Cost estimates for module replacement and repairs
- Prioritization by urgency and economic impact
- Warranty and insurance guidance for identified damage
Common defect types and their impact
Hotspots and overheating (critical)
Hotspots are among the most dangerous PV defects and can pose a fire risk when temperature differences exceed 15°C. They are typically caused by faulty bypass diodes, cell cracks, or wiring issues.
Characteristic features:
- Localized overheating of individual cells or cell groups
- Temperature differences of 10-30°C compared to surrounding areas
- Often accompanied by visible discoloration or blistering
- Progressive deterioration if not repaired
Impact on system performance:
- Up to 30% power loss in the affected string
- Accelerated aging of neighboring modules
- Potential safety risks due to overheating
- Loss of warranty if repair is delayed
Cell cracks and mechanical damage
Micro-cracks in solar cells are usually invisible to the naked eye but lead to gradual performance loss. Thermography reveals these defects through characteristic temperature patterns.
Causes and identifying features:
- Hail, mechanical loads, or installation errors
- Uneven temperature distribution in affected cells
- Strip-shaped or localized hotspots
- Often only visible years after installation
Long-term effects:
- Gradual performance loss of 5-15% per year
- Potential complete module failure as cracks progress
- Warranty claims typically require timely documentation
- Corrosion and moisture ingress as secondary damage
Shading issues
Partial shading can result from vegetation, new buildings, or soiling. Even small shaded areas can significantly reduce the output of entire strings.
Thermographic signatures:
- Noticeably cooler areas in shaded modules
- Hotspots in unshaded cells of the same string
- Bypass diode compensation patterns clearly visible
- Time-dependent patterns depending on sun position
String failures due to partial shading: Studies show that shading of just a single cell can reduce a string's total output by up to 75%. With larger shaded areas, the effects are even more severe - even partial shading often leads to losses far exceeding the proportion of the area that is actually shaded.
PID (potential-induced degradation)
PID effects occur particularly in older systems and can cause dramatic performance losses of 30-70%. Thermography detects PID via characteristic temperature patterns at the module edges.
Thermographic indicators:
- Elevated temperatures along module edges
- Uniform heating of entire modules or module sections
- Progressive spread across multiple modules
- Correlation with system age and operating voltage
Long-term yield losses:
- If left untreated, power loss can reach up to 70%
- Particularly critical in systems with voltages above 1000V
- Often reversible via potential equalization or deactivation
- Early detection enables warranty claims
Concrete benefits and ROI of drone inspection
Efficiency gains
The speed of modern drone inspections is transforming PV maintenance. What used to take days can now be completed in a few hours - with far greater precision.
Measurable time savings:
- Large-area coverage in record time: Entire PV systems can be fully inspected in 2-3 hours instead of several days, including all modules and cabling
- Parallel data capture: Simultaneous RGB and thermal imaging collects all required information in a single flight with no need for rework
- No operational downtime: Inspections are carried out during normal operation without production losses or complex shutdown planning
- Immediate on-site insights: Live viewing enables first assessments during the flight and direct decision-making
Cost savings
Comparison table: Traditional vs. drone inspection
| Aspect | Traditional inspection | Drone inspection |
|---|---|---|
| Time required | 3-5 days for a large system | 2-3 hours total |
| Labor costs | 2-3 technicians over several days | 1 pilot for a few hours |
| Additional costs | Scaffolding, lifts, fall protection | Flight costs only |
| Safety risks | Work at height, accident risk | Ground-based operation, minimal risk |
| Defect detection rate | 60-70% (visible damage only) | Up to 95% (including hidden defects) |
| Documentation | Manual, error-prone | Automated, GPS-accurate |
Additional cost savings:
- Avoiding scaffolding and lift rental saves roughly 500-1500€ per inspection
- Early fault detection prevents total failures and costly consequential damage
- Insurance benefits from regular, professional documentation
- Optimized maintenance planning through precise fault localization
Safety and compliance
Safety benefits:
- Elimination of all work at height and associated accident risks
- No need to walk on potentially damaged or slippery roof sections
- Reduced liability exposure for inspection companies and system owners
- Possibility to inspect even under challenging weather conditions
DIN-compliant documentation:
- Automatic generation of DIN-compliant inspection reports
- GPS-accurate localization of all defects for full traceability
- Complete documentation for insurers and audits
- Historical comparisons through regular inspections
When should you carry out a drone inspection?
Timing checklist for optimal results:
- After commissioning (year 1): Establish a baseline reference for later comparisons and identify installation errors early
- Before warranty expiry (years 4-5): Document hidden damage and assert warranty claims in time
- After extreme weather: Capture hail, storm, or other weather-related damage immediately for insurance claims
- In case of unexplained performance losses: Perform root cause analysis when monitoring data indicates problems
- Regular maintenance cycles: Every 2-3 years to maintain optimal system performance and enable preventive maintenance
- Before asset transactions: Due diligence for buying or selling assets to ensure transparent valuation
Best times of year:
- Spring/Summer: Ideal weather conditions and maximum irradiance for precise thermography
- After snowmelt: Damage from snow loads and moisture becomes visible
- Before harvest season: For ground-mounted systems, best access before vegetation growth
Integration into modern PV design workflows
From inspection to repair planning
The Airteam Fusion Platform links drone inspection seamlessly with 3D modeling and PV design. Faulty modules are not only identified, but directly incorporated into repair planning.
Seamless integration with leading software:
- Direct export to PV*SOL, SolarEdge Designer, and PVcase
- Automatic generation of bills of materials for identified repairs
- 3D models with centimeter-accurate defect localization
- Integration into existing maintenance management systems
Repair planning with AI support:
- Automatic prioritization based on criticality and ROI
- Optimized sequencing of repair activities
- Consideration of warranty and insurance aspects
- Cost estimates based on current material prices
Airteam Fusion Platform benefits
Unique combination of inspection and modeling:
- Thermographic inspection and 3D surveying in a single workflow
- Fast turnaround for complete 3D models with defect markers
- DIN-compliant accuracy with tolerances of ±1-3 cm
- Cloud-based platform for device-independent access
Workflow optimization for solar installers:
- Upload drone imagery via browser - no special software required
- Automatic AI analysis and defect detection
- Export to more than 15 different planning tools and file formats
- Central project management for all inspections and designs
FAQ: Frequently asked questions about PV drone inspections
How accurate is drone-based thermographic detection? Modern thermal cameras deliver an accuracy of ±2°C and reliably detect relevant temperature differences. Under optimal conditions, up to 95% of all defects can be identified - significantly more precise than visual inspections, which only capture around 60-70% of issues.
What weather conditions are required for an inspection?
Ideal conditions include: sunshine with at least 500 W/m² irradiance, wind speeds below 10 m/s, and no cloud cover. The system should operate under load for at least 1 hour so that defects show up thermally. Standard test conditions use 1,000 W/m², but for field inspections 500 W/m² is sufficient for meaningful results.
How long does a drone inspection take? A standard 50-100 kWp system can be fully inspected in 2-3 hours, including flight planning and live evaluation. Large ground-mounted solar farms take longer accordingly. Detailed AI analysis is typically completed within 24-48 hours after the flight, with a full report provided.
Can all types of PV systems be inspected? Yes, both rooftop and ground-mounted systems can be fully inspected. Drone inspections are especially cost-effective for larger systems from around 100 kWp upwards, where the cost-benefit ratio is most favorable. Individual faulty modules in large plants would otherwise go unnoticed in overall performance figures.
What is the economic benefit of regular drone inspections? Studies show that comprehensive PV maintenance can increase the average performance ratio from 92% to over 95%. For a 100 kWp system, an additional 3% output equates to roughly 1,200 kWh more energy per year - corresponding to an extra 150-200€ annually at current feed-in tariff levels.
Summary: Your path to optimal PV system performance
Drone inspections with thermography have become an indispensable technology for professional PV maintenance. The combination of speed, precision, and safety makes them the first choice for solar installers and system operators alike.
The key advantages at a glance:
- High defect detection rate using modern thermography, far exceeding traditional methods
- Dramatic time savings - from several days down to just a few hours for complex systems
- Up to 30-70% performance recovery through early detection of PID and other critical defects
- DIN-compliant documentation for compliance, insurance, and warranty claims with no extra effort
- Maximum safety by eliminating all work at height and associated accident risks
The Airteam Fusion Platform goes one step further: "With our unique combination of precise 3D modeling and thermographic inspection, we provide complete digital asset management from a single source - from defect detection through to repair planning."
Next steps for your PV projects: Start with a baseline inspection of your most critical systems and see for yourself how drone technology can transform your maintenance processes. In most cases, the investment pays for itself after the first major fault is identified and addressed.
Sources & facts
[S1] U.S. Department of Energy - Solar Energy Performance Data (2023): Average energy ratio of 79% for PV systems
[S2] Multiple Research Studies - Deep Learning Methods for PV Defect Detection (2023): Advanced AI algorithms achieve high accuracy for thermographic defect detection
[S3] FLIR Systems - Thermal Camera Specifications (2024): Professional thermal cameras achieve ±2°C accuracy specifications
[S4] International Energy Research - PID Impact Studies (2022): PID phenomenon can reduce PV output by 30-70%
[S5] Solar Engineering Research - Shading Impact Analysis: Shading effects on solar panel performance show disproportionate impact on system output
[S6] IEC Technical Specification 62446-3 - Outdoor Thermographic Inspection Standards: International guidelines for PV module thermographic inspection
[S7] Actuarial Data on PV Systems - O&M Performance Studies (2023): Comprehensive maintenance can improve performance ratio from 92% to 95%+